← Salvatore Zappalà's Website
Will China overtake the US in the AI race? (In charts)
NOTE: This is a written version of my YouTube video: Will China overtake the US in the AI race?
Two months ago, while reading IFP’s report How Should the US Prepare for Increasingly Automated AI R&D?, I came across this graph, showing how China’s electricity generation has been growing at a much steeper rate than in the US:
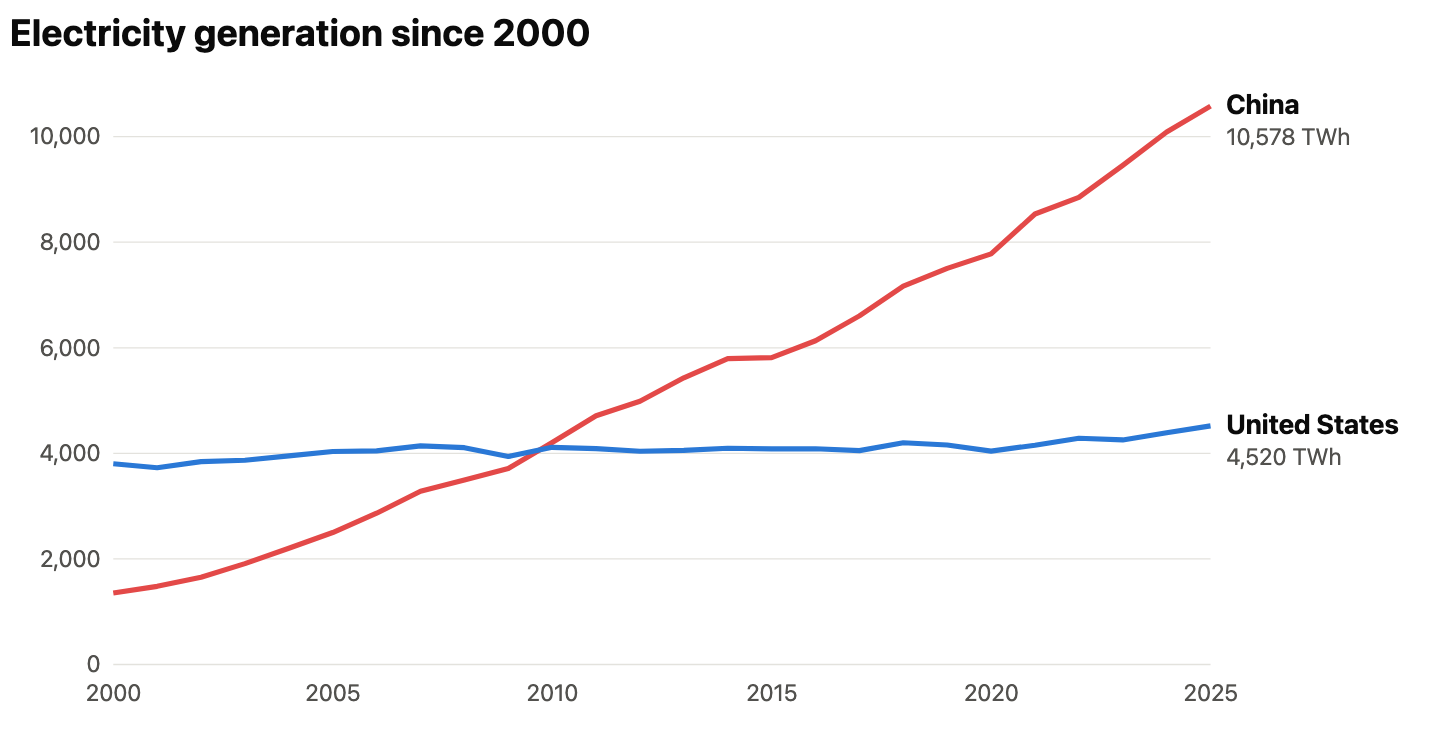
But, as is often the case with this kind of question, the answer is more complicated than it might initially seem.
In this article I share the findings of my research on this topic, mostly as charts.
Energy
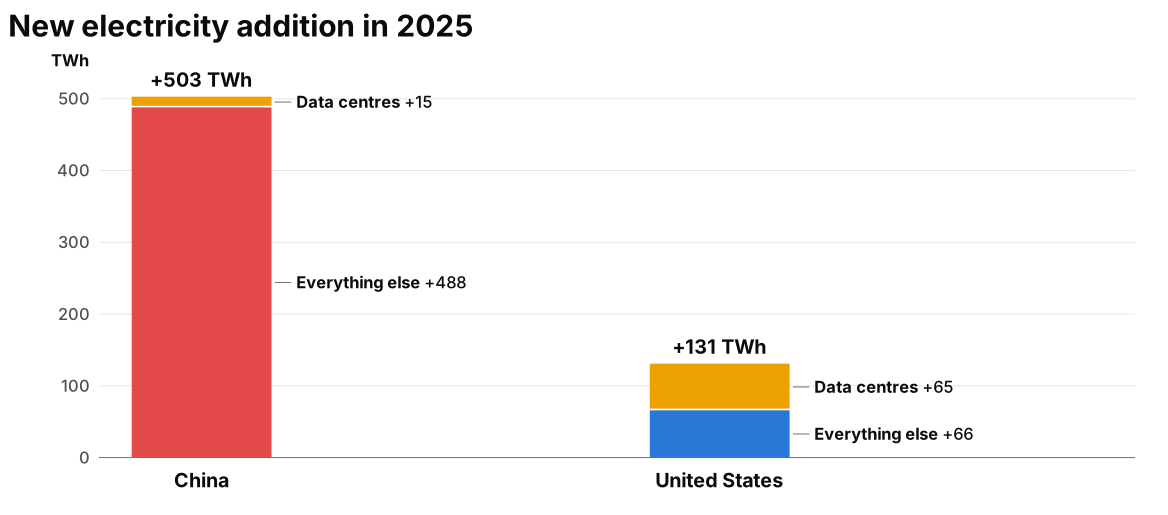
As the previous chart already showed, China added a lot more electricity than the US in 2025: 503 TWh against 131.
However, if we look at how much of it went into data centres, we get a very different picture. Only 15 TWh in China, about 3% of the new electricity, against 65 TWh in the US, which is half of everything the US added. There is a significant effort in the US to add electricity to the grid, and data centres are a substantial reason for this push.
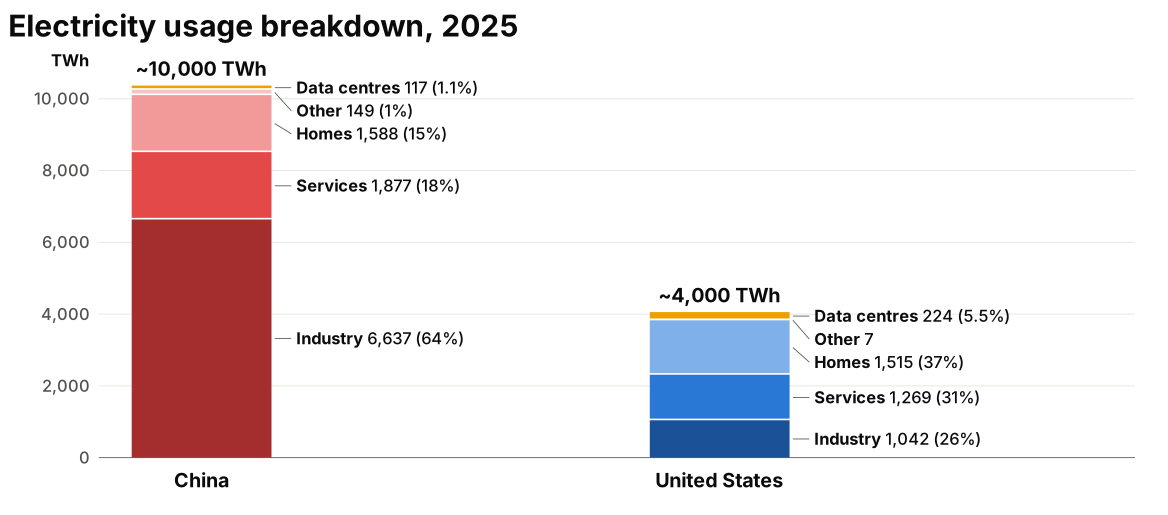
A further breakdown tells the same story. Most of the electricity in China is used by industry (64%). Data centres are a small part of the total in both countries, but a much higher share in the US: 5.5% against 1.1%.
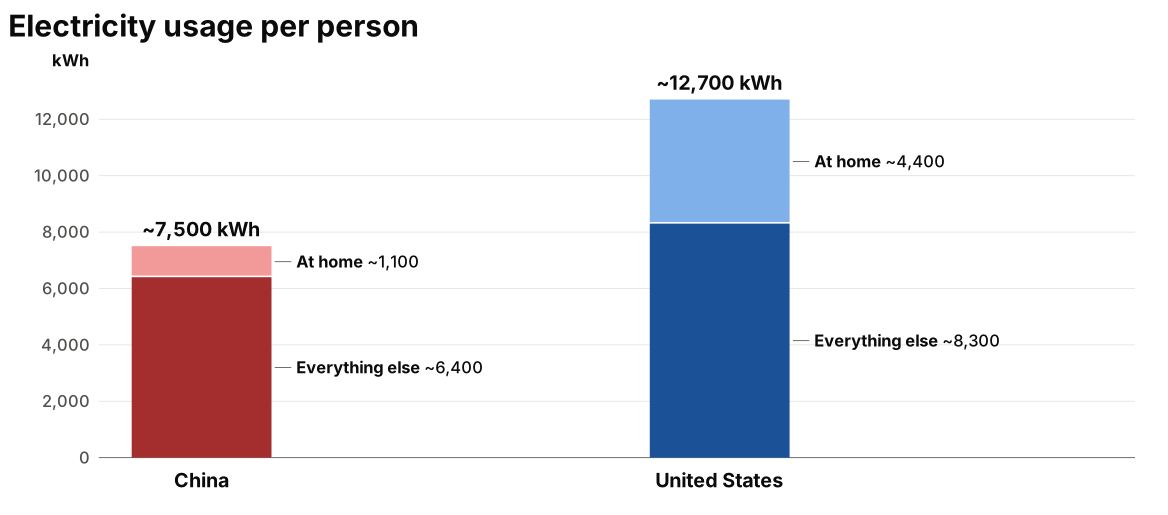
These are totals, though, and China has about four times as many people as the US. A good way to look at the general energy appetite of a country is the electricity usage per capita. The US uses about 70% more electricity than China, per person. If we only consider the electricity consumed at home, the difference is even bigger: four times as much. This indicates that the US population is much more energy hungry than the Chinese one.
So electricity is maybe not as big a factor as that first chart led me to think.
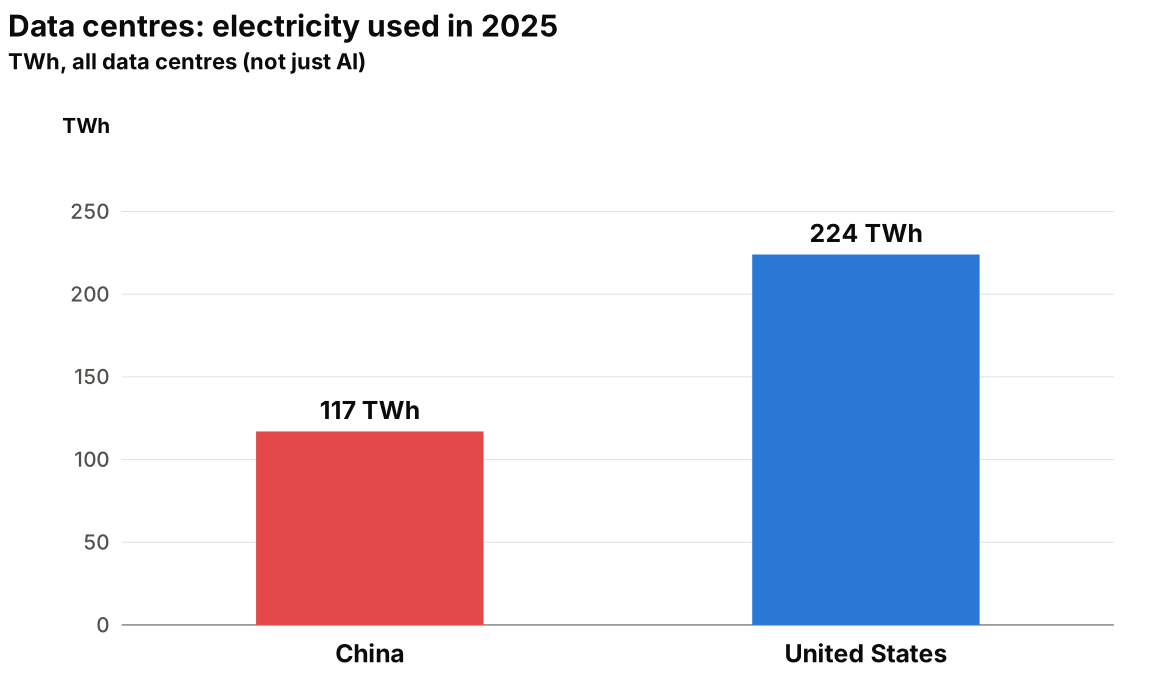
Looking only at data centres (not just AI), China used 117 TWh in 2025, around half of the amount used in the US.
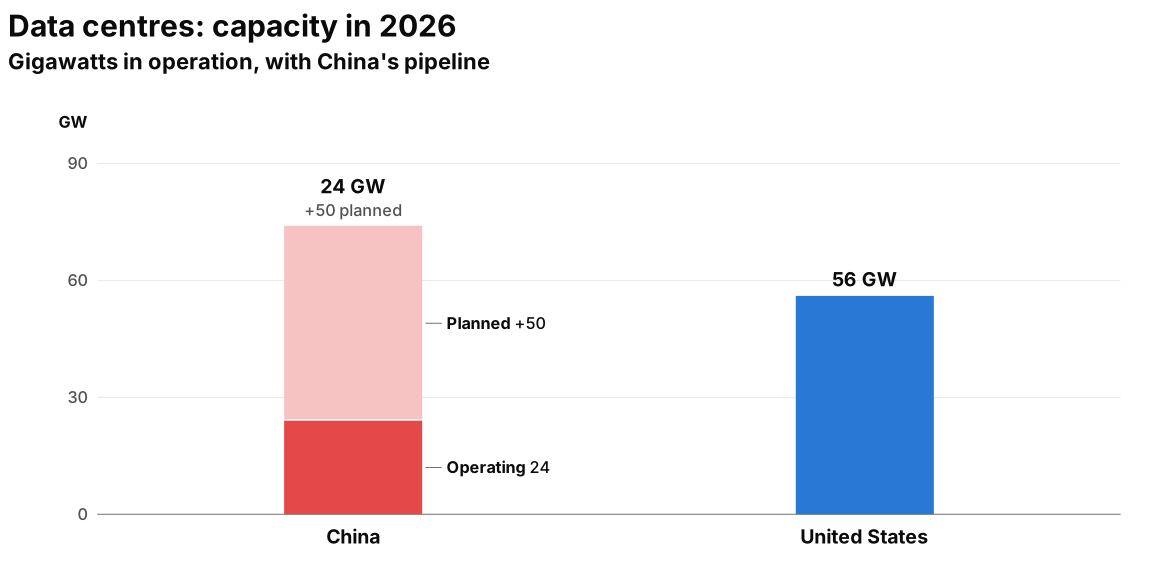
The same goes for capacity, the gigawatts in operation at any given time: China has 24 GW, again around half of the 56 GW in the US. China is planning to add another 50 GW soon, so this ratio might change, but the US is not standing still either.
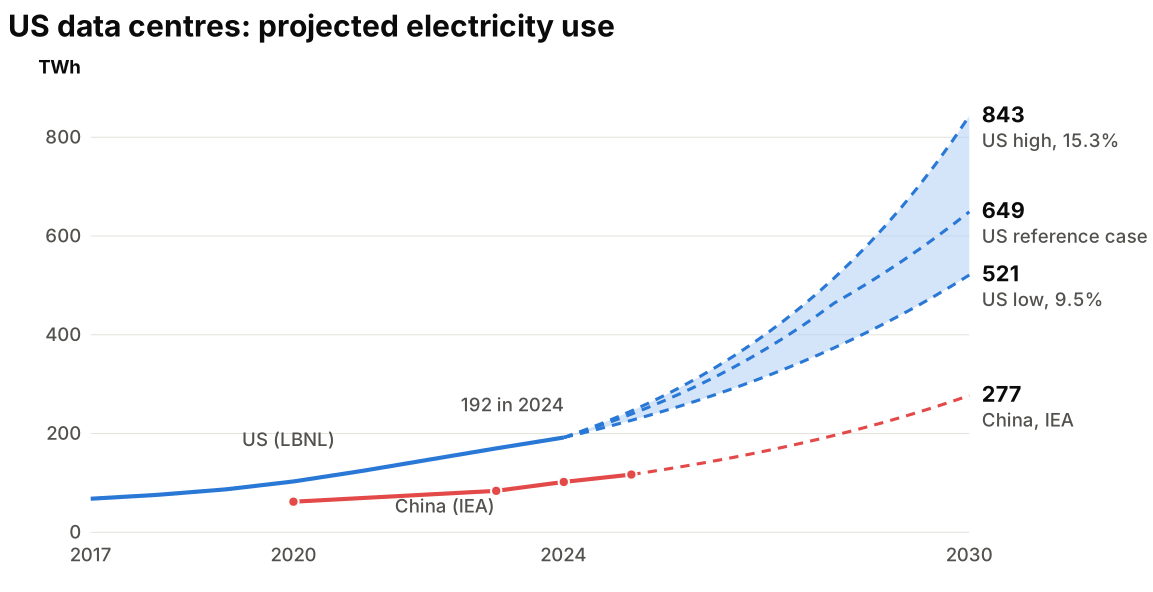
Looking at the projections of electricity use, the US ones are much steeper than China’s: from 192 TWh in 2024 to somewhere between 521 and 843 TWh in 2030, against 277 TWh for China. Keep in mind that the US projections are based on the GPUs and server racks expected to be delivered, not on the electricity that will actually be available. So they could be delayed by the electricity not being connected in time.
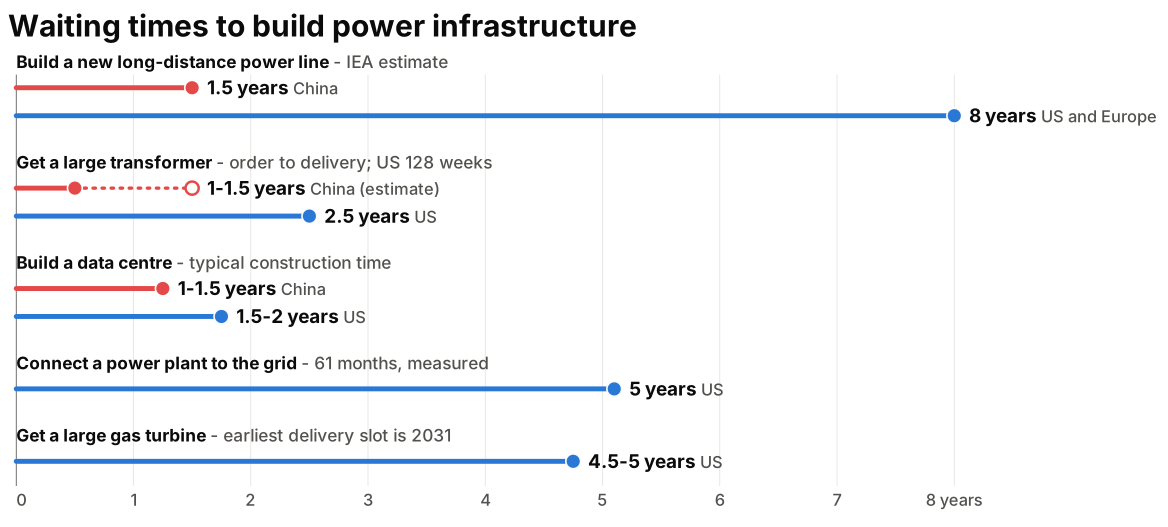
As I mentioned earlier, the electricity needs to be delivered to the data centre, and this can be another bottleneck. Building a new long-distance power line takes 1.5 years in China, against up to 8 years in the US and Europe. An insane difference. We saw during COVID how fast China can build things. Getting a large transformer takes 1 to 1.5 years in China and 2.5 years in the US. Building the data centre itself takes a similar time in both: 1 to 1.5 years in China, 1.5 to 2 years in the US.
For the US I also found two figures that I couldn’t find for China: connecting a power plant to the grid takes 5 years, and getting a large gas turbine 4.5 to 5 years (the earliest delivery slot is in 2031). Gas turbines are used more and more to power data centres. It’s not the most eco-friendly method, but it’s a quick patch where electricity can’t be delivered by better means.
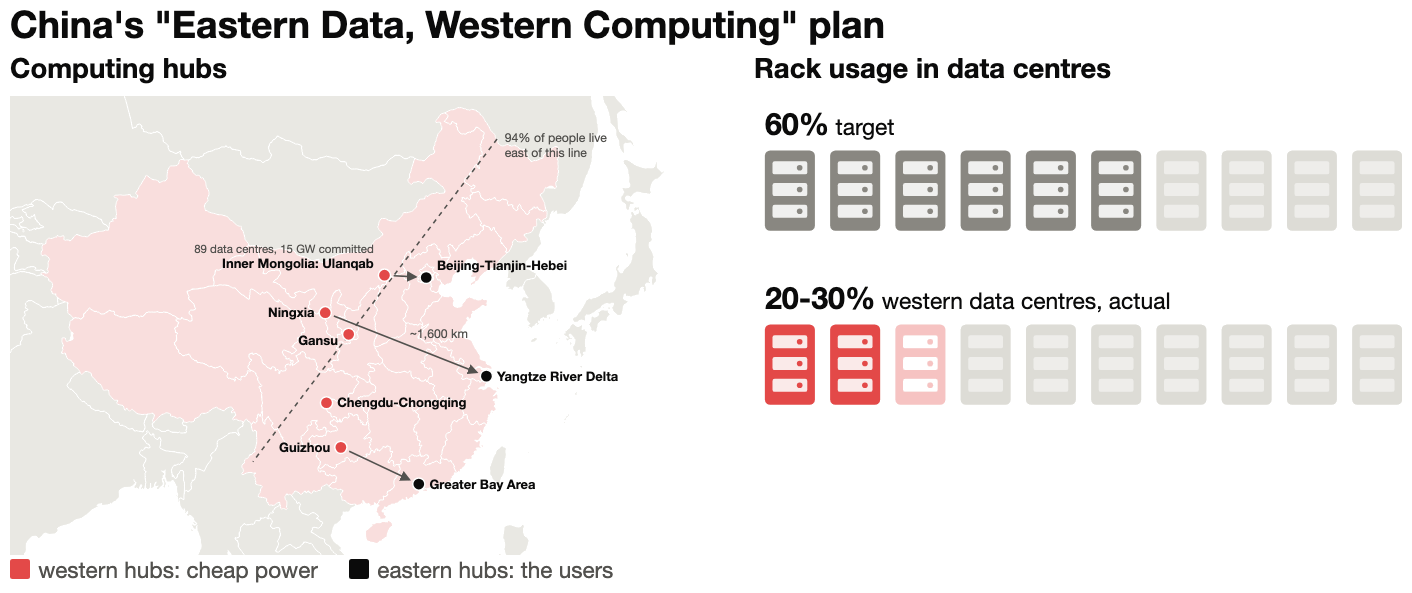
China has a plan to build out its computing capacity, called Eastern Data, Western Computing. The East is where most of the people live (94% of them live east of the dashed line), while the West has more energy and fewer people, so energy there is much cheaper. The government wants to favour building data centres in the West, to serve the hubs in the East.
There are a few bottlenecks, though. There isn’t enough fibre out West, so they are building that up, and building data centres in remote areas is a challenge in itself. The government also requires 60% of the racks in data centres to be full before new data centres can be built, and in May the western data centres were only 20 to 30% full. Most of them were sitting empty, because there weren’t enough GPUs to fill them. As we’ll see, the main bottleneck for China is compute.
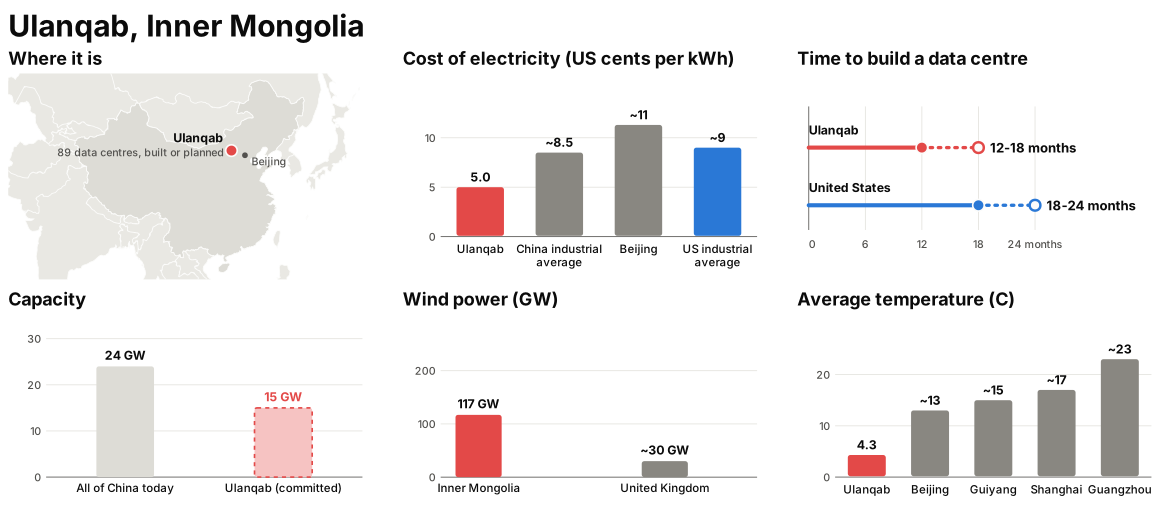
While I was finishing the presentation, the Financial Times published an article about Ulanqab, a city in Inner Mongolia where 89 data centres are built or planned. There are multiple reasons for this:
- Cheap electricity: about 5 US cents per kWh for data centres, much lower than the China industrial average (~8.5) and the US one (~9), and less than half the cost in Beijing.
- Speed: there is already a concentration of many companies, so building a data centre takes 12 to 18 months, against 18 to 24 in the US.
- Scale: 15 GW are committed in Ulanqab alone, compared with 24 GW in operation in all of China today.
- Wind power: Inner Mongolia has 117 GW of it. The whole United Kingdom has about 30.
- Cold weather: an average temperature of 4.3°C, which helps with cooling the data centres.
Compute
We saw that China has a lot of energy, with a few bottlenecks. Now let’s look at the mirror image: compute. This is where it gets really painful for China.
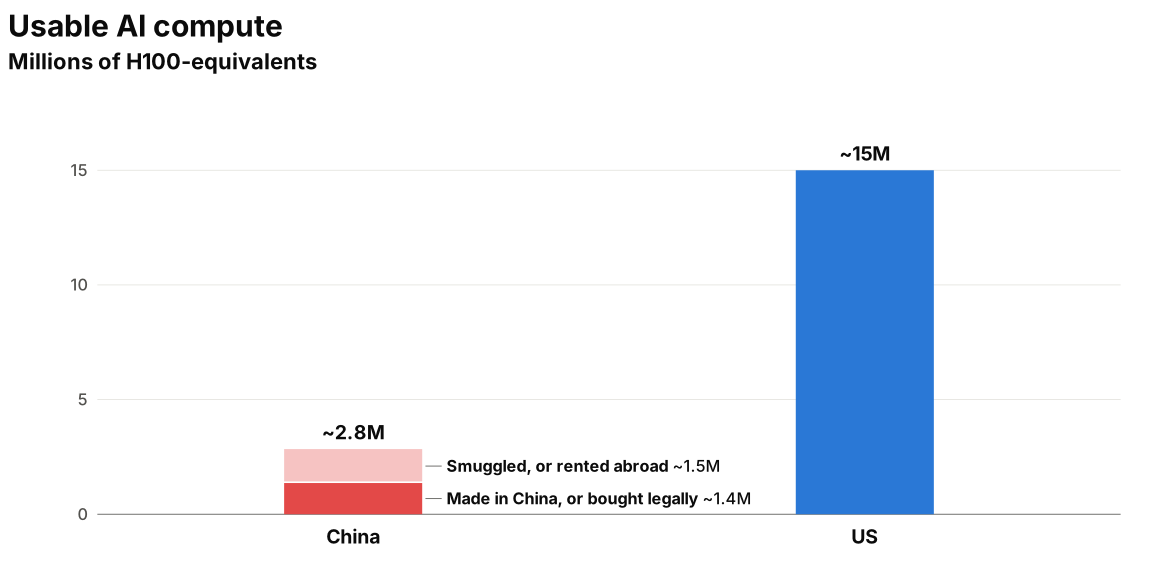
Measured in H100-equivalents (the compute of one Nvidia H100), the US has about 15 million to use for training, inference or anything else AI-related. China has just 2.8 million, and about half of it is smuggled or rented abroad. The other half is made in China or bought legally. China does have access to Nvidia cards, but as far as I know they are limited versions, not equivalent to the ones that can be bought in the US.
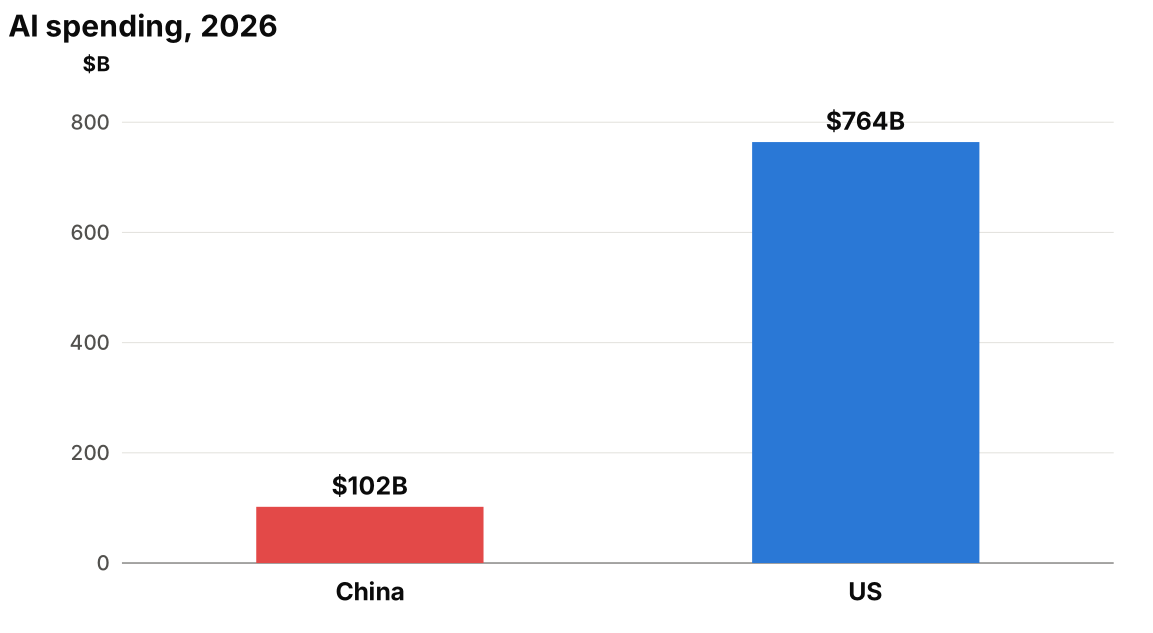
Spending is also very different, even though AI has been a top priority for China for a long time: $764 billion in the US in 2026, against $102 billion in China. A staggering, and somewhat scary, amount of money.
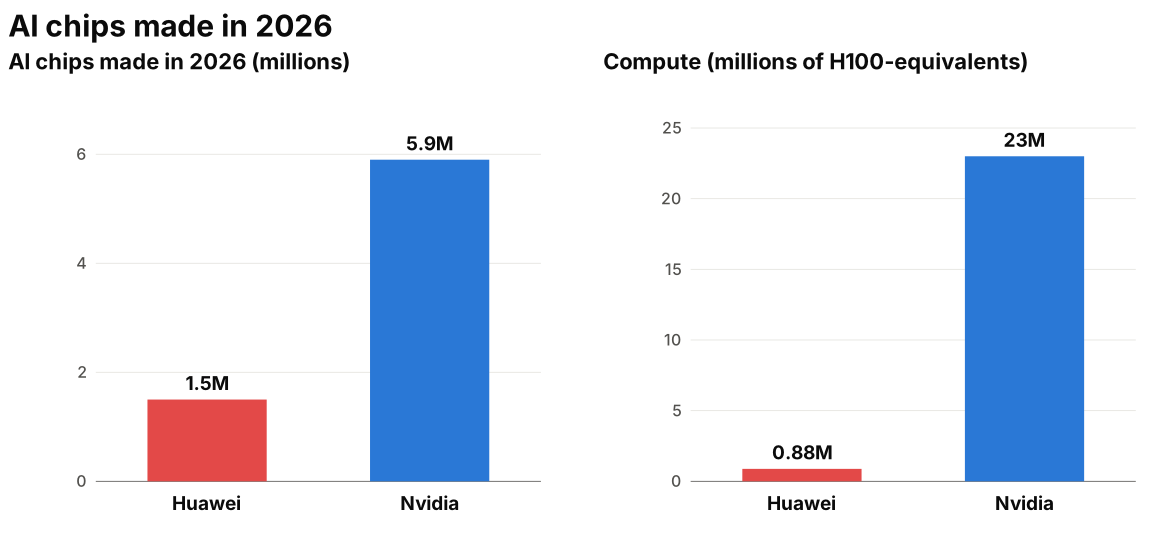
Another side of the compute bottleneck is where the chips are made. Nvidia is making far more chips than Huawei: 5.9 million against 1.5 million in 2026. And because Nvidia’s chips are so much more powerful, the difference in compute is enormous: 23 million H100-equivalents against 0.88 million.
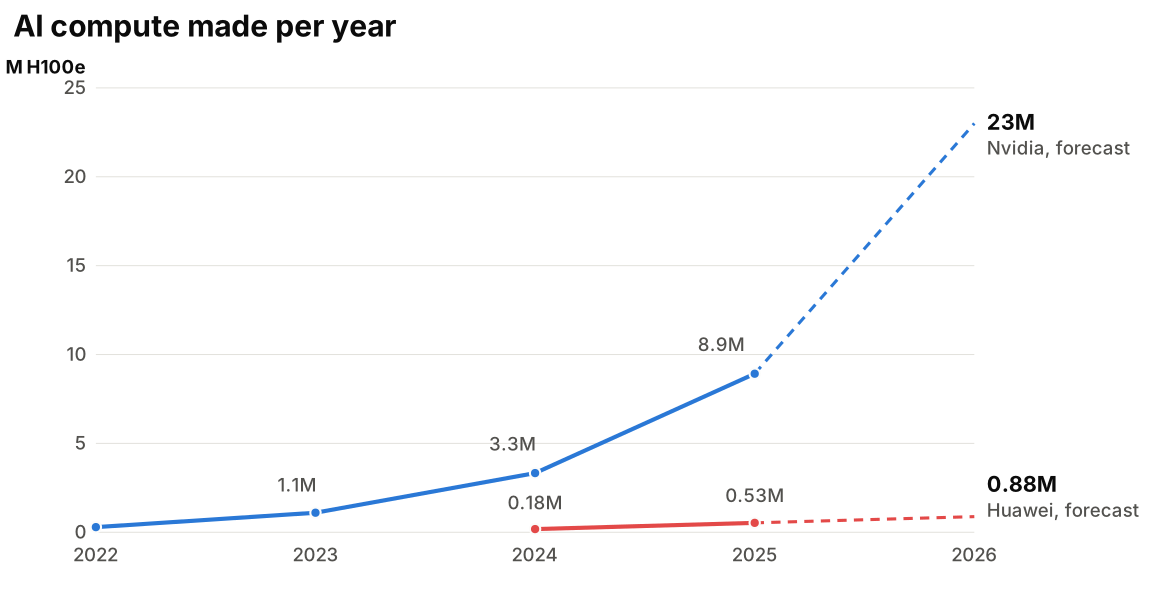
The gap is already massive, and the forecast is even more aggressive for Nvidia. They are in a much better position to keep developing more advanced chips and delivering them.
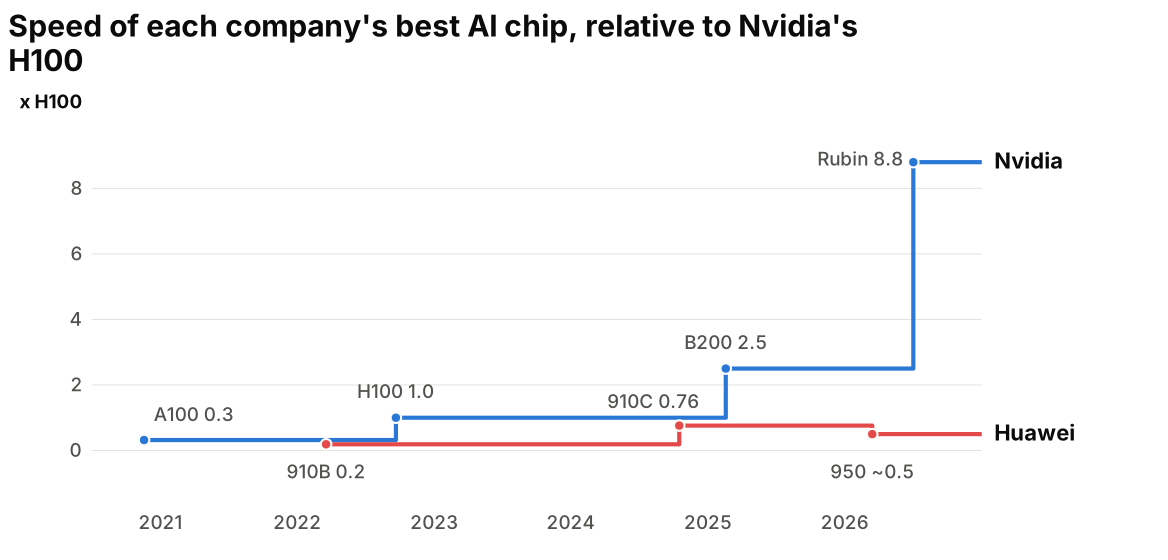
Comparing each company’s best chip, we can see a massive step up for Nvidia. The chart is a bit misleading for Huawei: it shows a step down, but that’s because it measures 8-bit computation, while Huawei’s latest chip is optimised for 4-bit. Still, there is no indication that Huawei is catching up with Nvidia at all. Actually, the opposite.
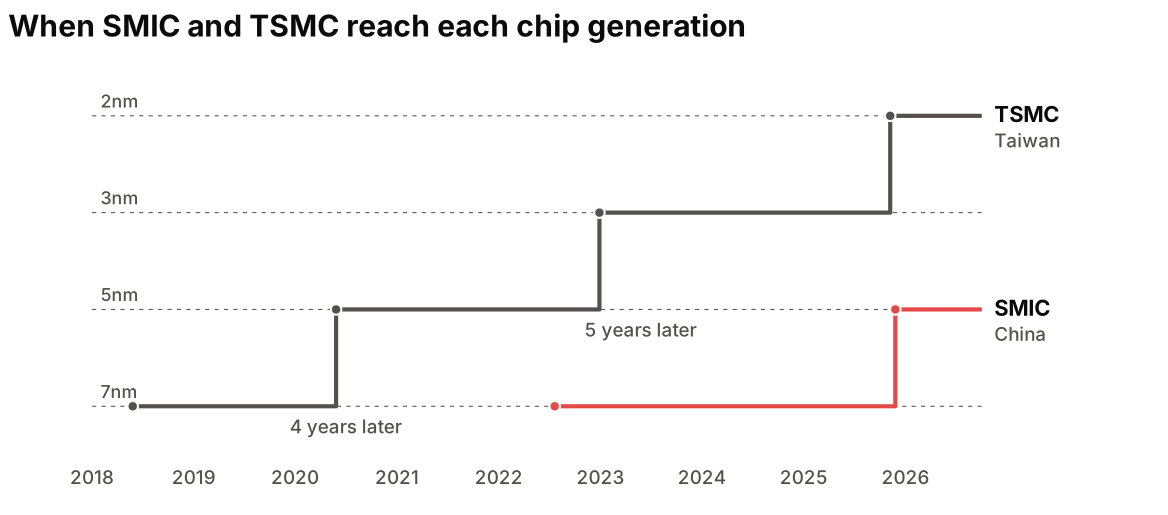
The same goes for the companies that actually manufacture the chips: TSMC, the Taiwan Semiconductor Manufacturing Company, and SMIC, its Chinese equivalent. SMIC reached 7nm four years after TSMC, and 5nm five years after. Taiwan is way ahead, and it takes a long time to catch up: every smaller scale is harder to reach than the last, and as we’ll see, it’s going to be particularly hard for China.
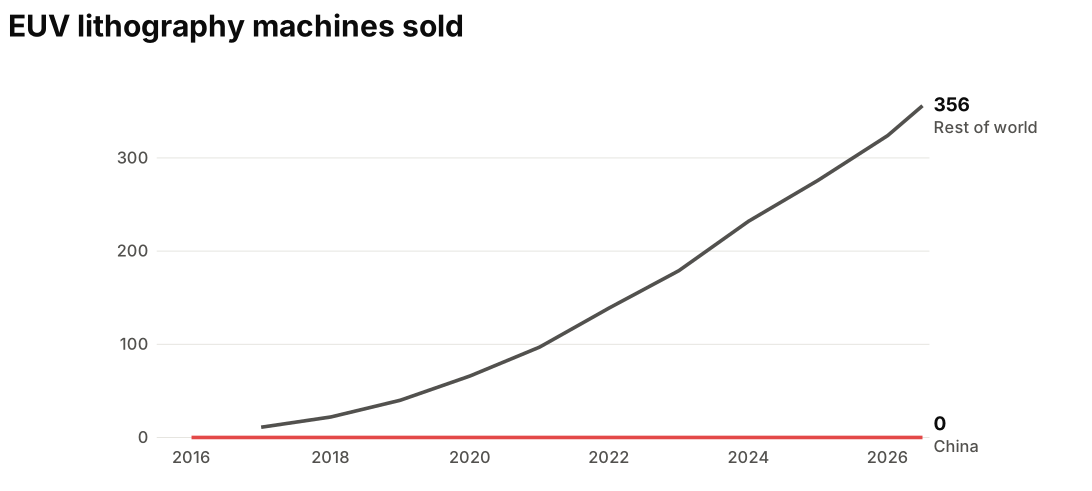
The most advanced chips (virtually all the ones used for inference or training outside China) are made using extreme ultraviolet (EUV) lithography machines. ASML, in the Netherlands, is the only company in the world that is able to build and ship them, and China can’t buy them. The Dutch government banned their export to China in 2019, under pressure from the US.
This is a major problem for China, as it severely hampers its ability to catch up with the latest generation of chips.
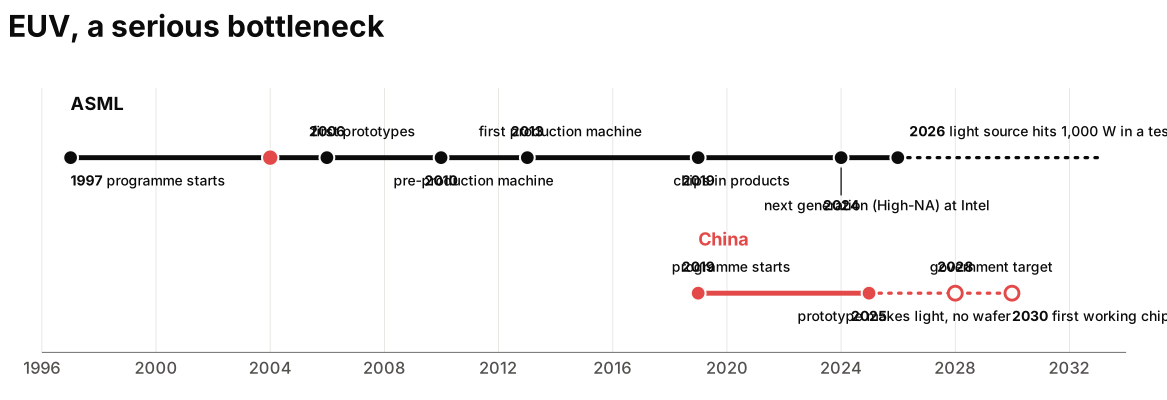
ASML has been working on EUV since 1997, and it took them until 2019 for chips made with it to end up in products. There’s a staggering amount of expertise, miniaturisation and technology in the engineering of these machines. China has tried to reverse-engineer them, so far without success, due to their complexity.
With the help of AI, more advanced technology and more scientists, China will need much less time than ASML did to reach the same milestones. But in 2025 their prototype was only able to produce the ultraviolet light, not to print anything with it. The red dot on the ASML line represents roughly where China is today compared with ASML’s timeline.
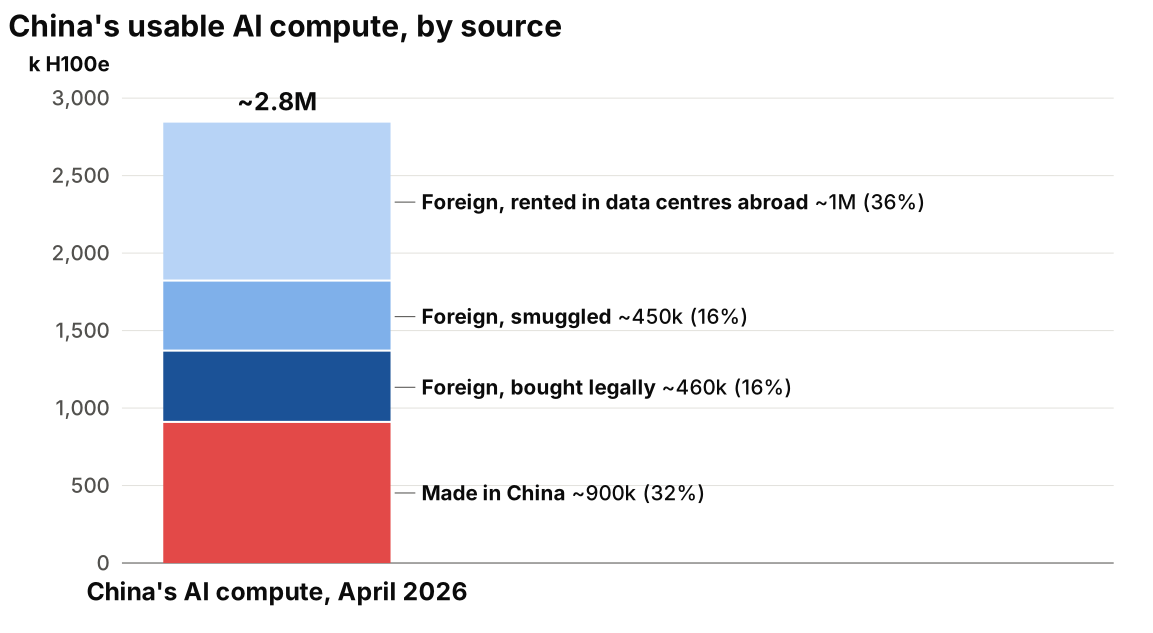
Breaking China’s compute down by source: only 32% of it is made in China, and the quality is not comparable to Nvidia’s chips. 16% was bought legally abroad and 16% is smuggled. And 36% is rented from data centres abroad: Chinese AI labs sometimes just rent compute outside China to do their training or inference.
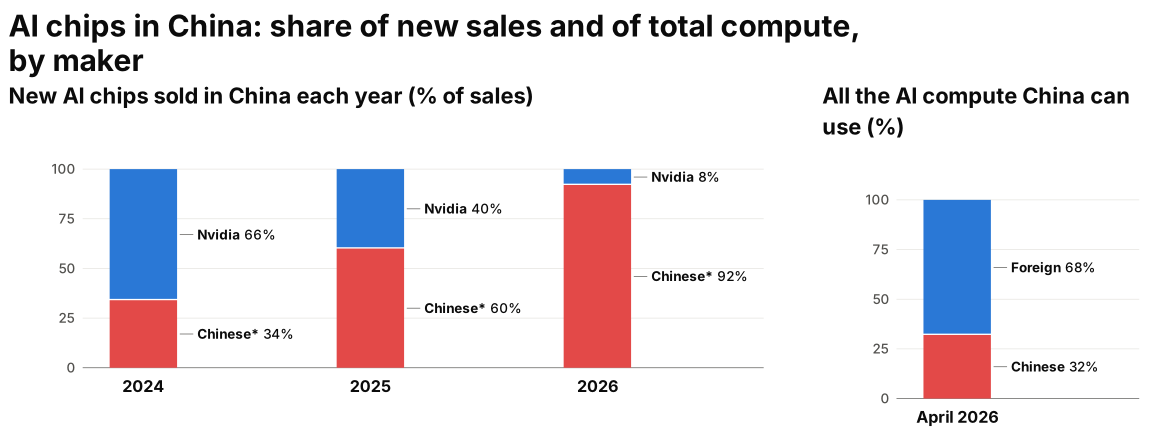
At the same time, more and more of the chips bought in China are Chinese. As far as I understand, this is mandated by the government, to enforce dogfooding and make sure their quality improves, after the hardship caused by export controls. The Chinese share of new AI chip sales rose dramatically, from about a third in 2024 to almost all of them in 2026. However, they still have a lot of foreign chips: as of April 2026, only a third of their compute was Chinese.
This is a problem in the short term, because the Chinese chips are subpar in performance compared to Western ones. But this will push and accelerate progress. China has a lot of young talent and a lot of researchers, and I’m sure that plenty of resources will be invested in this at a governmental level. It’s a very tough problem to solve, but we might be surprised.
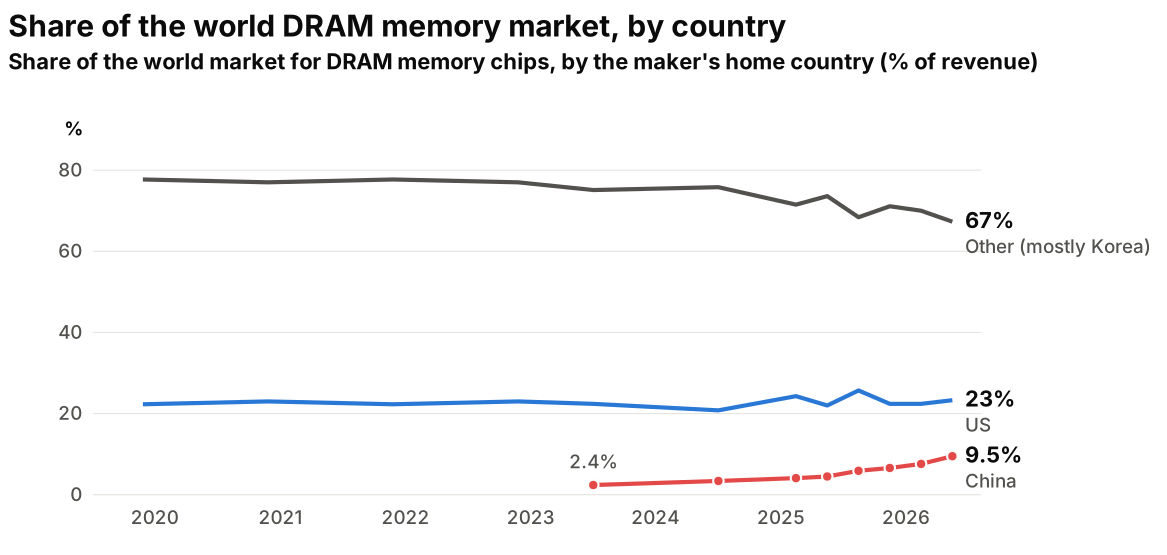
Memory is a different story. China is catching up in the DRAM market, going from 2.4% of the world market in 2023 to 9.5% in 2026. Most memory chips are made in the rest of the world, a good part of them in Korea.
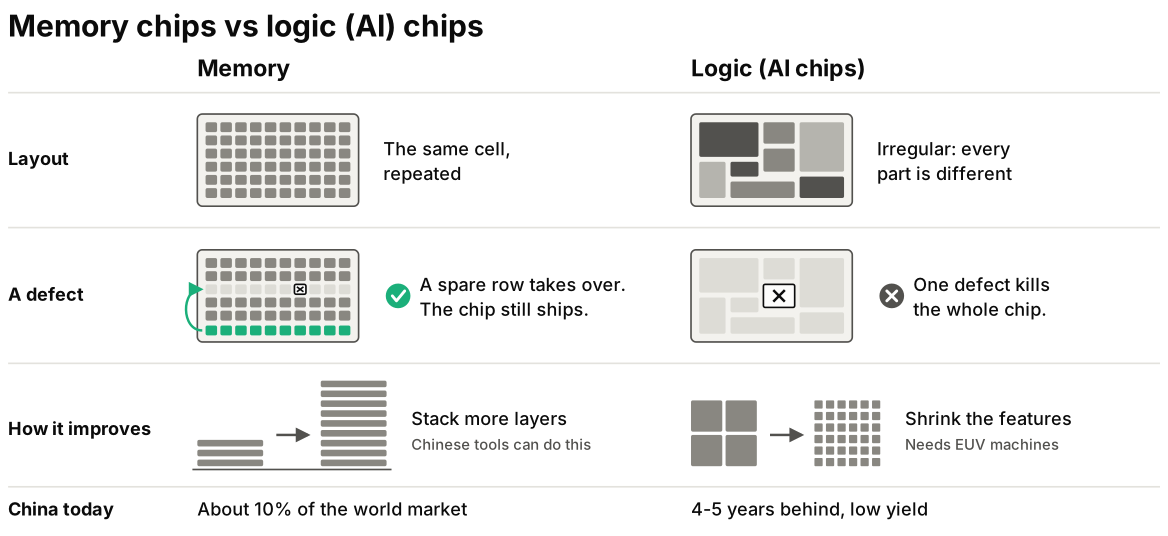
Memory chips are much easier to build than logic chips (GPUs, AI chips, however we want to call them), so I don’t think memory will be a true bottleneck for China:
- Layout: memory chips are vast arrays of the same repeating cell. Logic chips are irregular, with all sorts of logic built into them, which makes them much more complicated to develop and build.
- Defects: if a cell or a row fails in a memory chip, that row is simply bypassed. In a logic chip, one single defect means that the whole chip has to be thrown away. While researching this, I was shocked by how many chips get thrown away: for Huawei’s Ascend 910C, roughly four out of five in late 2024.
- Improvement: to improve memory you just stack more layers, and China already has the tools to do this. To improve logic chips you need to shrink the features, and that requires the advanced lithography machines that China doesn’t have on its own.
Models
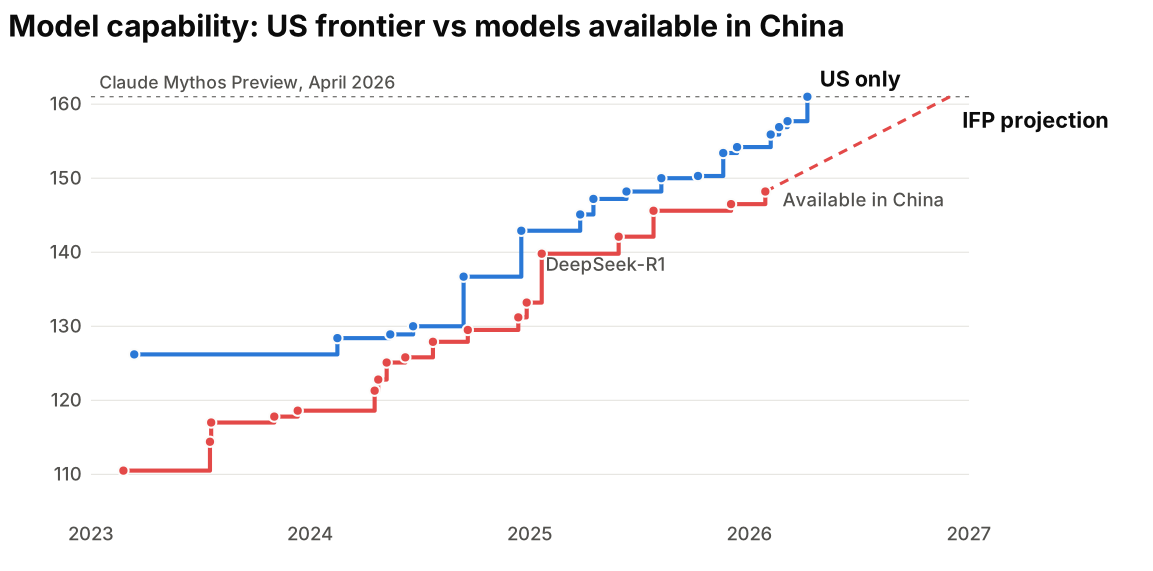
Even though it has much less compute, China is able to keep up on model capability: the gap between the frontier models in the US and the best models available in China is only about eight months.
First of all, credit where it’s due: there’s been a lot of ingenuity and a lot of incredible talent in China. Probably the lack of resources means that people need to be more resourceful. But there’s also distillation: training a model on the outputs of a stronger one. It’s probably not the only explanation for how China has been able to catch up so easily with less compute, but I think it’s undeniable that it plays a role. So the gap is not big, but the frontier is definitely in the US.
What does winning even mean?
There are multiple races going on. We can break the competition down into three:
| Race | Who’s ahead |
|---|---|
| Frontier model | US, by about 8 months |
| Commercial diffusion | Contested |
| Base models | China, on open weights |
The frontier model is the one we just discussed.
Commercial diffusion is about which providers companies will use. It’s unlikely that companies will build AI in-house, so they will very likely pick a provider. So far, Western companies use Western providers and Chinese companies use Chinese providers, and we don’t know which will win out in the long run. So in my opinion, this one is contested.
Base models are about how many people download open-weight models, customise them, build on them. Here China is winning by far. This might have been the strategy all along, maybe to undermine the profitability of the frontier AI companies in the US. A lot of open-weight models have been released in China, and they are the ones most open-source applications use.
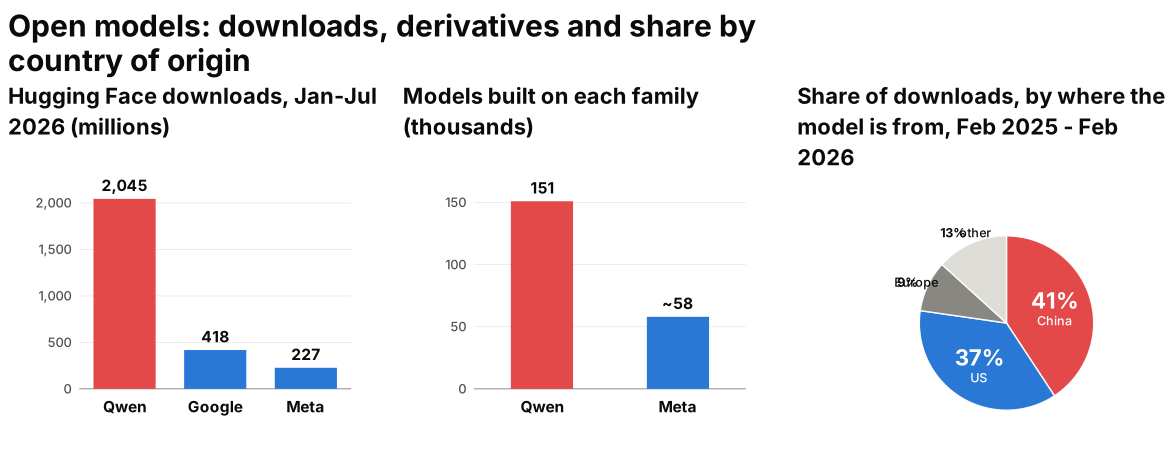
Alibaba’s Qwen was downloaded about 2 billion times on Hugging Face between January and July 2026, way more than Google’s (418 million) and Meta’s (227 million) models. It’s also by far the most built upon: 151 thousand models are derived from it, against about 58 thousand from Meta’s. Maybe the picture will change a little now that Mistral has released its latest model, Le Chonk. If we look at the share of downloads by where the model comes from, it’s a closer call, 41% against 37%, but China is still ahead.
Talent
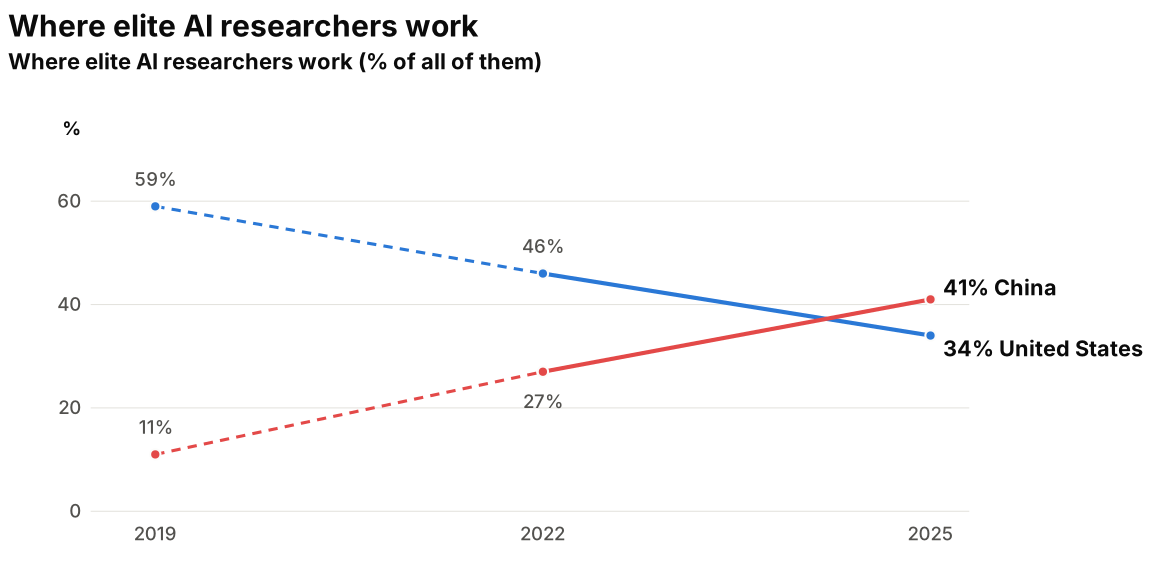
This is a very important angle: people. You need very smart, very well prepared people to do AI research at the frontier, and there has already been a crossover between China and the US. In 2025, more elite researchers were working in China than in the US.
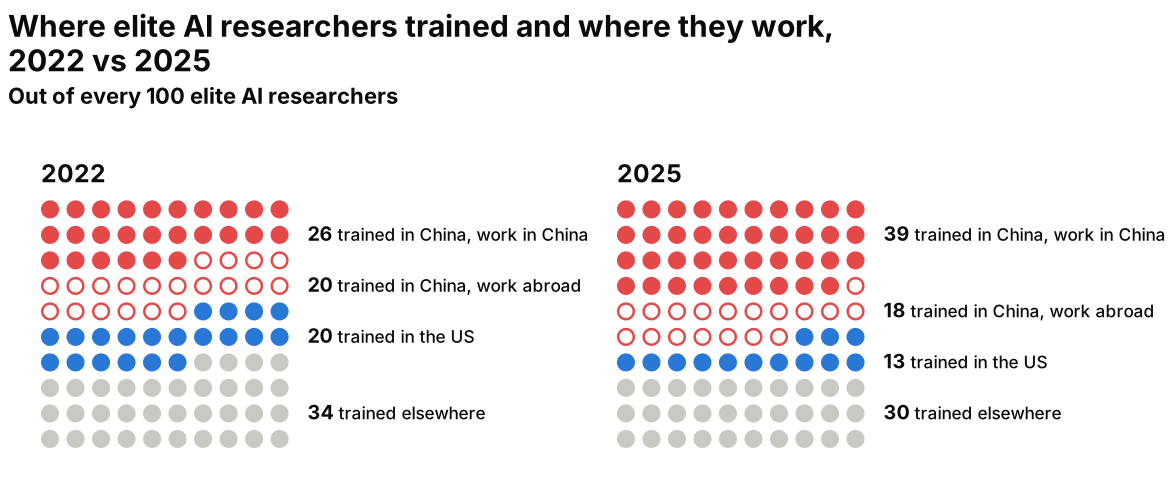
Breaking it down by where they trained: out of every 100 elite AI researchers, the ones trained in China who also work in China went from 26 in 2022 to 39 in 2025. Those trained in China who work abroad, mostly in the US, went from 20 to 18, and those trained in the US from 20 to 13. It’s an increasing trend: Chinese AI researchers see the opportunity to just work at home, and more and more of them are making that choice. This can play a big role in the development of AI in China.
Competing, or developing together?
Instead of competing, could the US and China develop AI together? RAND outlines seven strategies for the United States:
| Strategy | The US wins when… | |
|---|---|---|
| A | Dominance | It gets there first and suppresses rivals |
| B | Co-Development | It governs superintelligence jointly with rivals |
| C | Preparedness | Informal coordination, resilient to accidents |
| D | Moratorium | Everyone agrees to halt above a threshold |
| E | Deterrence | It prevents dangerous AI by threat and force |
| F | Continuity of Society | Self-sustaining settlements survive |
| G | Acceleration | Maximum development, markets sort it out |
The two that I want to focus on are dominance, which sounds like what the US is going for at the moment, and co-development. In a better world, it would be amazing if the US and China could tackle AI together, especially since AI poses existential threats to all of us.
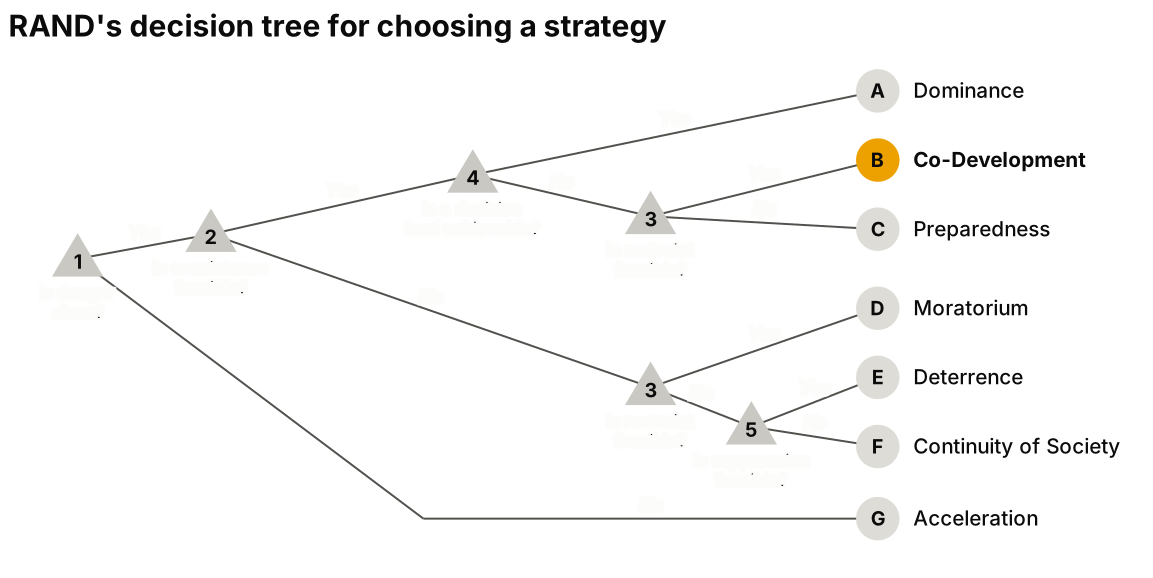
RAND doesn’t advocate for any of these strategies, but it presents a decision tree that the US could follow to choose one. If danger is close, coexistence is feasible and a decisive lead is achievable, we go straight to dominance. That seems to be the scenario the US thinks it is in, and in my opinion dominance is clearly what we’ve been seeing. But if a decisive lead is not achievable and restraint is feasible, then there could be co-development. It’s wishful thinking, but one can dream.
And as if to confirm that, this is how it looks from Beijing. Right after Dario Amodei’s essay calling on AI labs to slow down, which I discussed in a previous video Existential risks posed by AI and inevitable loss of control , China’s Foreign Ministry was asked about it and replied:
“Fear-mongering, confrontation and vicious competition will only hamper efforts toward sound global AI governance, which serves no one’s interest.”
Guo Jiakun, China’s Foreign Ministry, 14 September 2026
I think it’s a very reasonable take. And it’s only to be expected that they were upset by Amodei’s essay, which, among other things, said that if China won the AI race, we would be in big trouble.
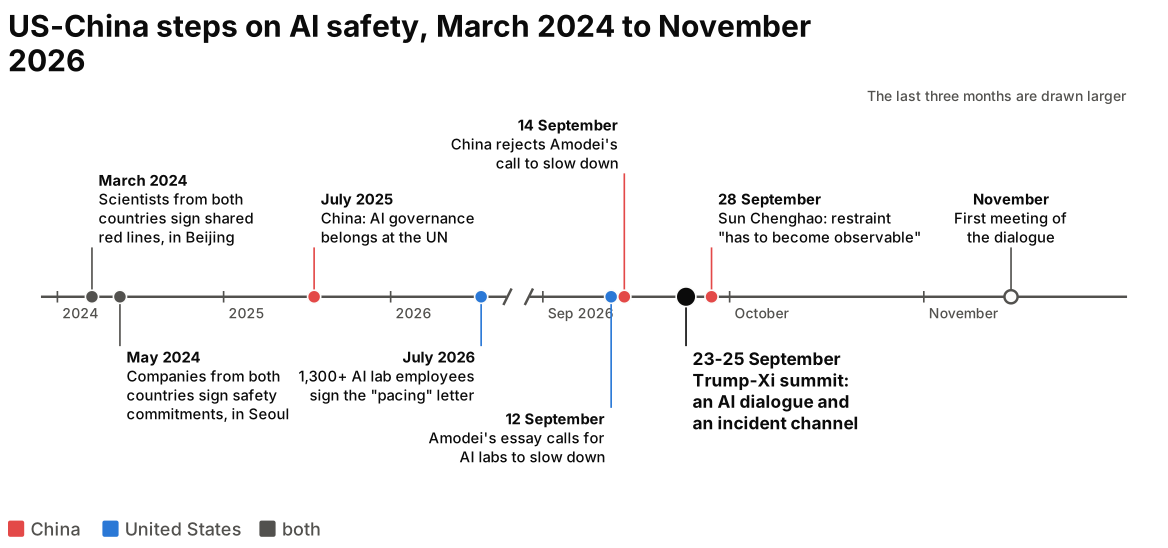
So what could collaboration look like? I arranged the possible steps as a ladder, cheapest first:
- Incident hotline: already agreed in September 2026. A line that connects the US and China directly, so that they can talk and coordinate in case of an incident. It’s similar to what we had during the Cold War for nuclear incidents, which I hope is still operational.
- Shared red lines, common tests: the same safety tests on both sides. There are conversations going on at the moment. We’ve seen the Trump-Xi summit, but not much serious work coming out of it.
- Observable restraint: slowing down, and giving visibility on what was slowed and why. I believe this will happen only if there’s really no other way forward, but one wants to hope that restraint will be possible if necessary.
- Verification of compute: knowing where the big training runs happen. This conversation is also happening among US labs, which want to see what the others are doing. So far it’s only talk, but let’s hope it will happen, between labs and between countries.
- Joint development: a “CERN for AI”, a single lab where the US and China work together. As I said, one can dream.
There’s a quote that I find very relevant, from Sun Chenghao, a researcher at Tsinghua University:
“Before restraint can become reciprocal, it has to become observable.”
Sun Chenghao, Tsinghua University, 28 September 2026
We can talk as much as we want, but if we can’t observe what the other side is doing, restraint is not possible.
Where things stand
| Who’s ahead | |
|---|---|
| Frontier model | US, by about 8 months |
| Commercial diffusion | Contested |
| Base models | China, on open weights |
| Talent | China: more elite researchers now work there |
| Energy | Depends on the horizon |
| Chips | US, resting on allies |
The US has a clear advantage on the frontier model. Commercial diffusion is contested, and China is ahead on base models, with its open-weight models.
China is ahead on talent, and that matters because talent can take development to another level.
Energy depends. China has much more capability to increase its energy capacity, so if energy became the bottleneck, it’s possible to believe that China would be able to unlock another level. But as we’ve seen, energy doesn’t seem to be the bottleneck.
Chips are a very important one, and the US has a serious lead here, resting on its allies: TSMC in Taiwan and ASML in the Netherlands, unless Chinese talent manages to crack chip manufacturing and build lithography machines that can make chips competitive with the Western ones. So far, they seem to be quite a bit behind.
Thank you for reading. If you found this interesting, you can follow me on Bluesky, X and YouTube.
Sources
The slides cite each source next to the chart it supports, and they are also collected on a single page.
Energy
- Institute for Progress, “How Should the US Prepare for Increasingly Automated AI R&D?” (Aug 2026): electricity generation; also model capability and the collaboration ladder
- Ember, Global Electricity Review 2026 and IEA, Global Energy Review 2026: new electricity in 2025
- China’s National Energy Administration and the US EIA: usage breakdown
- IEA, Key Questions on Energy and AI (2026): data centre electricity, same method for both countries, and China’s projection
- SemiAnalysis, “The Chinese AI Infrastructure Boom” (Sept 2026), via the Financial Times: data centre capacity
- Lawrence Berkeley National Laboratory, 2025 Update (June 2026): US data centre projections
- Ember, yearly electricity data: electricity per person (“at home” is residential use divided by population)
- LBNL, Queued Up 2026, IEA (2025), Wood Mackenzie, TBEA and GE Vernova: waiting times (China’s transformer figure is a rough estimate)
- ASPI Strategist (May 2026) and China Briefing: Eastern Data, Western Computing
- Financial Times, reporting from Ulanqab (Oct 2026): Ulanqab, and data centre build times. Prices converted at about 7.1 yuan per dollar; UK wind is derived from the FT’s “nearly four times”
- Maps: Natural Earth
Compute
- ChinaTalk (April 2026): China’s usable compute and its sources. The US figure is my estimate from Epoch AI data
- Goldman Sachs estimates, via Al Jazeera (Sept 2026): AI spending (US: Google, Amazon, Microsoft, Meta, Oracle; China: Alibaba, Tencent, Baidu, ByteDance)
- Epoch AI, Huawei’s roadmap to 2031 (Sept 2026) and Epoch AI, Data on AI chip sales: chips made, compute per year, chip speed
- TSMC announcements and TechInsights teardowns of SMIC-made chips: chip generations
- ASML annual reports, ASML, “Making EUV: from lab to fab” and Reuters (Dec 2025): EUV machines and timelines. UBS (Sept 2026) for China’s EUV against ASML’s
- Bernstein, via Tom’s Hardware: AI chip sales in China
- Financial Times, via DigiTimes (Feb 2025), and TrendForce (Nov 2024): Huawei Ascend 910C yield
- TrendForce DRAM revenue rankings, CXMT’s listing prospectus, via Business Reporter and Counterpoint: memory market
Models and talent
- Epoch Capabilities Index, redrawn from IFP’s chart: model capability
- Hugging Face, State of Open Models (Aug 2026) and State of Open Source, Spring 2026: open models
- Carnegie Endowment, AI Talent v3.0 and MacroPolo’s Global AI Talent Tracker (2019): elite AI researchers
Cooperation
- RAND PE-A5105-1 (Sept 2026): the seven strategies and the decision tree
- China’s Foreign Ministry press conference, 14 Sept 2026, reported by Rest of World
- CNBC and Fortune on the summit, and the IDAIS Beijing statement: the timeline
- Sun Chenghao, “Why China doubts US calls to pause AI” (Sept 2026)